 |
 |
 |
Tivoli DM Monitor
The SiteScope Tivoli DM Passive Monitor allows to integrate data collected by Tivoli Distributed Monitors into SiteScope.
Usage Guidelines
What can be measured by this monitor?
The Tivoli DM Passive Monitor allows you to collect any measurement monitored by Tivoli DM engine running on any platform supported Tivoli End Point. You can monitor multiple parameters or counters with a single monitor instance. This allows you to watch server loading for performance, availability, and capacity planning. Create a separate monitor instance for each Tivoli End point running Tivoli DM engine in your environment.
What should be done in Tivoli environment?
The Tivoli DM Passive Monitor listens for incoming TEC SENTRY events and extracts from it sampled data. Tivoli Sentry profiles need to be changed in order to post the desired measurements to the monitor in the form of TEC event. By default the monitor listens for incoming events on TCP port 5529. To configure Tivoli Sentry profile:
- Open profile definition
- Open desired monitor definition
- Add Send Enterprise Console event respond and set up parameters of SiteScope host and Tivoli DM Passive Monitor port in the Server field in the format <Hostname>+<PortNumber>
- Repeat steps 2-3 for all desired counters
- Save and distribute profile
The following is an example display of the Tivoli DM Edit Monitor Window:
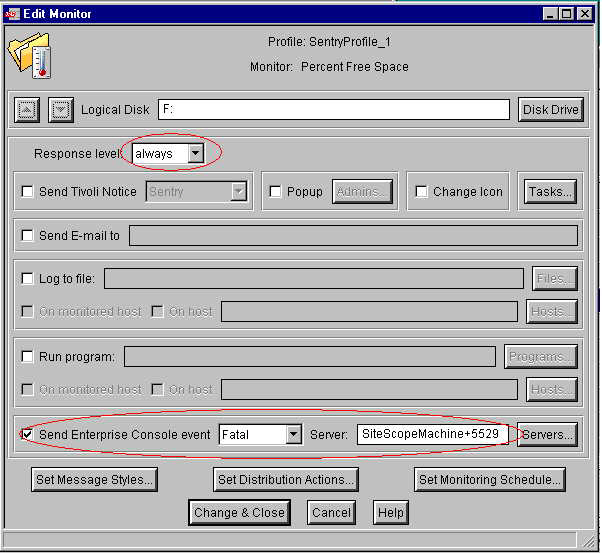
The default run schedule for this monitor is every 10 minutes, but you can change it to run more or less often using the Update every setting. It is recommended that you set monitor scheduling that closely matches the appropriate Tivoli DM monitor scheduling.
Completing the Tivoli DM Passive Monitor Form
To display the Tivoli DM Passive Monitor Form, either click the Edit link for an existing Tivoli DM Passive Monitor listed in a monitor table, or click the add a Monitor link on a group's detail page and choose the "New Tivoli DM Passive Monitor " link.
Complete the items on the Tivoli DM Passive Monitor form as follows: When the required items are complete, click the Add Monitor button.
- Server
- Choose the server you want to monitor. Use the choose server link to view a list of servers.
- Counters
- Choose the server performance parameters or counters you want to check with this monitor. The table list to the right of this item displays those currently selected for this monitor. Use the choose counters link to bring up the counters selection screen. Check or clear the check boxes on the choose counters screen to select between one to ten counters to monitor on this server.
- Update every
- Enter how frequently the monitor should check the alert repository. The drop-down list to the right of the text box lets you specify time increments of seconds, minutes, hours, or days. You must specify a time increment of at least 15 seconds.
- Title
-
Enter a title text for this monitor. This text is displayed in the
group detail page, in report titles, and other places in the SiteScope
interface. If you do not enter a title text, SiteScope will
create a title based on the host, server, or URL being monitored.
Advanced Options
The advanced options give you the ability to customize error and warning thresholds. If you choose not to set them, SiteScope will use preset defaults if available. If a default is not available, SiteScope will not be able to utilize the condition.
- Disable
- Check this box to temporarily disable this monitor and any associated alerts. To enable the monitor again, clear the box.
- Verify Error
-
Check this box if you want SiteScope to automatically run this
monitor again if it detects an error. When an error is detected,
the monitor will immediately be scheduled to run again once.
Note: In order to change the run frequency of this monitor when an error is detected, use the Update every (on errors) option below.
Note: The status returned by the Verify Error run of the monitor will replace the status of the originally scheduled run that detected an error. This may cause the loss of important performance data if the data from the verify run is different than the initial error status.
Warning: Use of this option across many monitor instances may result in significant monitoring delays in the case that multiple monitors are rescheduled to verify errors at the same time.
- Update Every (on error)
-
You use this option to set a new monitoring interval for
monitors that have registered an error condition. For example, you
may want SiteScope to monitor this item every 10 minutes normally,
but as often as every 2 minutes if an error has been detected. Note
that this increased scheduling will also affect the number of
alerts generated by this monitor.
- Schedule
-
By default, SiteScope monitors are enabled every day of the
week. You may, however, schedule your monitors to run only on
certain days or on a fixed schedule. Click the Edit
schedule link to create or edit a monitor schedule.
For more information about working with monitor schedules,
see the section on Schedule
Preferences for Monitoring.
- Monitor Description
-
Enter additional information about this monitor. The Monitor
Description can include HTML tags such as the <BR>
<HR>, and <B> tags to control display format and style.
The description will appear on the Monitor Detail page.
- Report Description
-
Enter an optional description for this monitor that will make it easier to
understand what the monitor does. For example, network traffic or
main server response time. This description will be displayed on
with each bar chart and graph in Management Reports and appended to
the tool-tip displayed when you pass the mouse cursor over the
status icon for this monitor on the monitor detail page.
- Depends On
-
To make the running of this monitor dependent on the status of
another monitor or monitor group, use the drop-down list to select
the monitor on which this monitor is dependent. Select
None to remove any dependency.
- Depends Condition
-
If you choose to make the running of this monitor dependent on the
status of another monitor, select the status condition that the
other monitor or monitor group should have in order for the current
monitor to run normally. The current monitor will be run normally
as long as the monitor on which it depends reports the
condition selected in this option.
- List Order
-
By default, new monitors are listed last on the Monitor Detail
page. You may use this drop-down list to choose a different
placement for this monitor.
Setting Monitor Status Thresholds
Some Integration monitors allow you to set multiple threshold conditions to determine the status reported by each monitor. The individual conditions are combined as logical OR relationships so that when one or more of the conditions (for example any of the conditions for Error if) are met the monitor status is set to the applicable condition. If multiple conditions are met for more than one status condition (such as conditions for both error and for warning), the status for the monitor is set to the highest valued condition. Thus a match of an error condition and a warning condition would be reported as an error status, error being the highest value, warning the next highest and good the lowest value.
- Error if
- Use one or more of the selection boxes in this item to define one or more error conditions for this monitor. Use the drop-down lists in these items to change error threshold(s) relative to the counters you have selected to check with this monitor. After choosing a counter or parameter, use the comparison operator drop-down list to specify an error threshold such as: >= (greater than or equal to), != (not equal to), or < (less than) and enter a comparison value in the box provided. Comparison values should be entered as whole numbers.
- Warning if
- Use one or more of the selection boxes in this item to define one or more warning conditions for this monitor. Use the drop-down lists in these items to change warning threshold(s) relative to the counters you have selected to check with this monitor. Set these values relative to those you set for the error threshold in the Error if item.
- Good if
- You can set this monitor to return
a good status for certain conditions. You may define those conditions here.
Complete this item as you would for the Error if and Warning if
items.

Copyright © 2004 Mercury Interactive Corporation.
All rights reserved.
|
|
|