 |
 |
 |
SiteScope Progress Report
Monitoring the availability of systems and servers that deliver business-critical services to users and customers is the focus of SiteScope. Together with the SiteScope Health monitoring, the Progress Report Page provides several key indicators you use to monitor the performance of the SiteScope application.
This section describes:
- About the SiteScope Progress Report
- The Monitoring Load Table
- Understanding Monitoring Load
- The Recent Monitors Table
About the SiteScope Progress Report
The SiteScope Progress page provides an overview several key SIteScope server performance metrics. At the top of the page, the SiteScope monitoring load statistics are displayed. The table in the lower section of the page displays which SiteScope monitors are running, and which monitors have run recently, at what time, and what was the returned status. This page is updated every 20 seconds, so the information is always current.
The Monitoring Load Table
The Monitoring Load table is an important indicator of SiteScope performance. The following is a sample monitoring load table.
| Monitors Run Per Minute | Monitors Running | Monitors Waiting | |
|---|---|---|---|
| Current | 29.50 | 0 | 0 |
| Maximum | 36.60 at 3:56 AM 10/6/03 | 98 at 2:16 AM 10/6/03 | 41 at 6:26 AM 10/6/03 |
Maximums are since last startup at 2:16 AM 10/6/03
The following is an explanation of the data shown in the report table. Individually and taken together, these measurements are the primary measure of how heavily loaded the SiteScope server is as currently configured. For each statistic, the current and maximum values are displayed.
|
Parameter |
Description |
|---|---|
|
Monitors Run Per Minute |
This is a rolling average of the last 10 minutes of monitoring, and tracks the rate (per minute) at which monitors are being run. |
|
Monitors Running |
This number represents the number of monitors queued for execution, based on their update frequency or schedule, that currently have execution threads. This means they are being executed. |
|
The Monitors Waiting |
This measurement is the complement of the Monitors Running measurement representing the number of monitors queued for execution, based on their update frequency or schedule, that currently are awaiting execution threads. This means they are not being executed. |
Understanding Monitoring Load
Monitoring Load can be a key indicator of SiteScope scaling problems, monitor configuration problems, or network performance issues. The following is a brief explanation of the SiteScope monitor execution model and interpreting the Progress Report in the context of this model.
A SiteScope monitor instance is essential an instruction set that is to be executed by the SiteScope application on a regularly scheduled interval. While a monitor instance is defined, SiteScope queues the monitor for execution based on the run (update) frequency and schedule options. If the monitor instance is marked as disabled, it is still scheduled in the queue but the normal instructions are not executed.
As a Java-based application, SiteScope makes use of multi-threading to accomplish parallel execution of monitor tasks. Each monitor instance scheduled for execution is assigned a thread. Once it is assigned a thread, the monitor instance becomes a "Monitor Running". It remains bound to the thread until the monitor execution instruction has either received a result or the timeout value, if applicable, has been reached.
Even in this model, monitor execution is not instantaneous and there is a finite limit to the number of monitor threads that can be executed in parallel. If not more threads are available, a monitor that is queued for execution becomes a "Monitor Waiting" for an execution thread.
It is difficult to assign specific values and limits to SiteScope Monitoring Load because the specifics of the server capacity and network deployment can vary widely. The monitoring load may also vary significantly over time simply due to transient network traffic issues or SiteScope monitor configuration problems.
One key warning signal for interpreting monitoring load is the ratio of Monitors Waiting to Monitors Running. Generally, having some monitors waiting for execution is not a problem unless the ratio of Monitors Waiting to Monitors Running is consistently 1:2 or higher. For example, if the number of monitors running is at the maximum of 100 and there are 50 monitors waiting, this represents a ratio of 1 monitor waiting for every two running.
Note: The maximum number of monitor execution threads for monitors to run is controlled by the _maxMonitorsRunning=100 setting in the master.config.
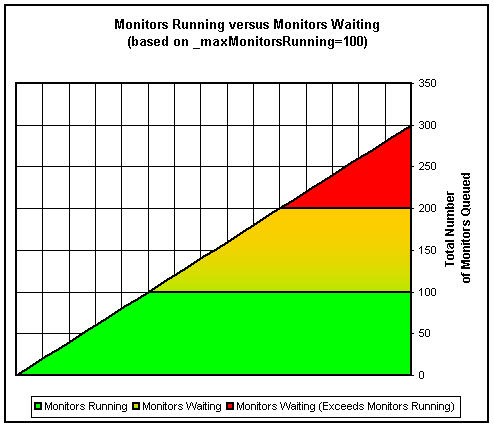
The graph below presents a visualization of the relationship between Monitors Running and Monitors Waiting. This graph is based on the default _maxMonitorsRunning setting of 100 monitors. The green region shows that SiteScope is able to run all queued monitors until the number of queued monitors exceeds 100. At that level, additional monitors that are scheduled to run are given the status of Monitor Waiting. The red region represents an area where the number of monitors waiting is more than twice the number of monitors running. This is certain indication that your SiteScope monitor configurations are not well aligned with the capacity of the server and network.
Two monitor configuration settings to adjust if there are consistently too many monitors waiting are:
- Update Every (frequency)
- This is the basic schedule parameter for every monitor type. A large number of Monitors Running and Monitors Waiting can often be explained by a large number of monitors set to run (or update) at short intervals. The minimum update interval is 15 seconds. Depending on a number of system factors, there are several monitor actions which may take more than 15 seconds to complete. For example, Web transactions, database queries, logging onto remote servers, and some regular expression matches may delay monitor completion. Use the Monitor Summary Report to the frequency setting for groups of monitors and consider increasing the value for some monitors.
- Verify Error
- Regular or extensive use of this option has the effect of rapidly increasing the monitor run queue whenever the applicable SiteScope monitors detect an error condition. While this option has its purpose, it should not be used by default on every monitor. Use the Monitor Summary Report to list monitors that may have the Verify Error setting enabled.
The Recent Monitors Table
Below the monitoring load table is the list of recent monitors run by SiteScope. The table is divided into two subsections with a simple blank row dividing the two sections. The first monitors in the list are displayed in bold text and indicate monitors that are currently being executed. The monitors displayed below the blank row divider are displayed in plain text and indicate the monitors that have most recently completed execution. As noted above, the Progress Report page is automatically updated every 20 seconds
The following is a sample Recent Monitors table.
Recent Monitors |
| Date | Group | Monitor | Status |
|---|---|---|---|
| 1:07pm 01/08/97 | Network | will update monitor Connection to Web Server 100 | in 28 seconds |
| 1:07pm 01/08/97 | server | Disk space on /dev/root | ok 86% full |
| 1:06pm 01/08/97 | Server | CPU usage | ok 2% used |
| 1:06pm 01/08/97 | Network | Internal Router | ok 2 ms |
| 1:06pm 01/08/97 | Network | Test Router | ok 2 ms |
In this example only one monitor instance, the Connection to Web Server 100 monitor instance, is being executed. The information in each column of the Recent Monitors table is described as follows:
- Date
- The date and time the monitor ran.
- Group
- The group to which the monitor belongs.
- Monitor
- The name of the monitor that SiteScope ran.
- Status
- The status returned by the monitor.

Copyright © 2004 Mercury Interactive Corporation.
All rights reserved.
|
|
|