 |
 |
 |
Linking Multiple SiteScope Servers with the Multi-view Panel
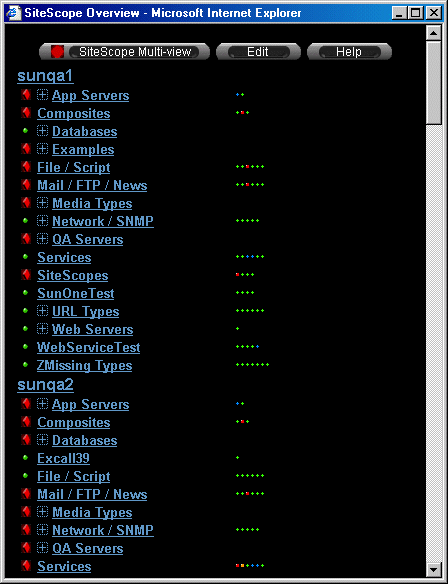
You use the SiteScope Multi-view Panel to view the status of several installations of SiteScope running on different machines. For example, you could have SiteScope installed and running on six Web servers located in different departments in your company. Using the SiteScope Multi-view Panel, you could watch the status of each of these SiteScopes from one central location. You can even access these SiteScopes from the Multi-view Panel, enabling you to handle all administration tasks from a single location.
An example of the SiteScope Multi-view Panel if shown below.

Multi-view Panel Navigation
There are several features on the Multi-view panel used for navigating, viewing, and administering the servers displayed in the panel. At the top of the panel are navigation controls for working with the SiteScope Multi-view. These button provide the following functions:
- SiteScope Multi-view
- This button displays
a summary status icon which indicates the worst state category reported by
the servers and monitors being polled by the Multi-view.
Clicking this button forces a manual refresh of the Multi-view display.
- Edit
- Click this button to display page listing the servers currently being polled,
controls used to add, edit, or delete
remote SiteScope servers from the Multi-view display, and to options for configuring
other Multi-view display settings. The Edit page is opened in a new browser window.
- Help
- Click this link to view the help page for the Multi-view panel (this page)
Each SiteScope server that is being polled by this Multi-view is listed by server name or IP address. The server name (or IP address) is a hyperlink to the SiteScope main panel for that server.
Listed beneath each server name are the groups defined for that server. Each group name is a link to that group's detail page on the applicable SiteScope server. To the left of the group name is a status icon which indicates the overall status for that group. If all monitors in the group are reporting an OK status, the icon will be a green circle. Otherwise the icon will indicate the most serious (worst) condition reported by any monitor(s) in the group.
The list of groups is an flexible tree display of elements that can be
expanded or collapsed. Tree control features are displayed to the left of
group names. Click the  icon to collapse a branch of the display tree. Click the
  icon to expand a branch and view the subgroups and monitors within a group.
To the right of the group name is a string of smaller status icons. Each of these icons represents one monitor in the group. These icons allow you to quickly assess whether one monitor's reporting a problem, or several monitors are reporting problems. Move the mouse cursor over any of the status icons to view a tool tip (if your browser supports this feature) with the name and current status of that particular monitor.
 |
 |
 |
