 |
 |
 |
The Monitor Browser
You use the SiteScope Monitor Browser to display your monitors using a variety of filtering views independent of which group they are in. Using the filtering options you can display a listing of monitors based on their current status, name, or monitor type. The Browse Monitor Table also presents links that allow you to view and edit a particular monitor in the same way as the Monitor Group Detail Table.
This section describes:
- About the Monitor Browser
- Monitor Browser Filter Options
- How to Filter by Monitor Type
- The Browse Monitor Table
About the Monitor Browser
The Monitor Browser provides a consolidated listing of monitors based on some common characteristic. For example, you can display all monitors that are in error, display only URL Monitors with a particular name, or display all disk space monitors. The Monitor Browser also provides hyperlinks to the monitor groups which you use to navigate directly to the group where a particular monitor is found.
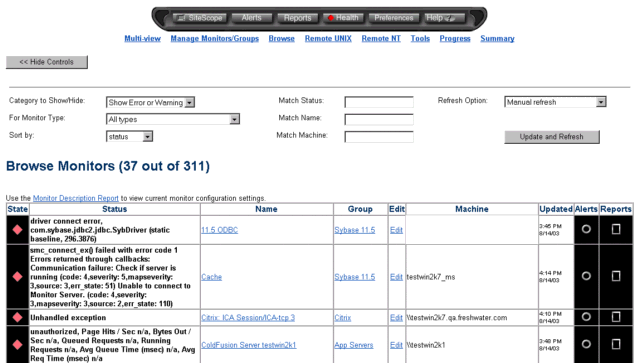
To display the Monitor Browser, click the Browse Monitors link in the navigation menu. The following shows an example of the Monitor Browser page with the default filter option set to show monitors reporting an error or warning condition.

The Monitor Browser page is divided into two sections. The upper section presents the filter options for the browser. The lower section displays the monitors in table format based on the filter criteria selected.
Monitor Browser Filter Options
Use the drop-down lists and text boxes below the navigation bar at the top of the page to select which monitors you want SiteScope to display. Then use the Refresh button to display the monitors based on the filter options you have selected.
- Category to Show/Hide
-
You use the first drop-down list on the upper left to select
monitors based on their reported status. Use the drop-down list to
select the status criteria that you wish to display, such as error,
warning, or OK. The default setting is to display monitors that are
currently reporting errors or warnings. Some options allow you to
exclude certain monitors. The category options are:
- Show Error or Warning
- Show Error
- Show Warning
- Show OK
- Show No Data
- Show Disabled
- Show Acknowledged
- Hide Error or Warning
- Hide Error
- Hide Warning
- Hide OK
- Hide No Data
- Hide Disabled
- Hide Acknowledged
- Show All Categories
- For Monitor Type
-
Use this selection box to select a specific monitor type to
display. You can choose to view only the monitors of a given type,
such as URL, database, or Service. By default, monitors of all type
are shown. To choose another type, click the scroll arrows on the
right side of the box.
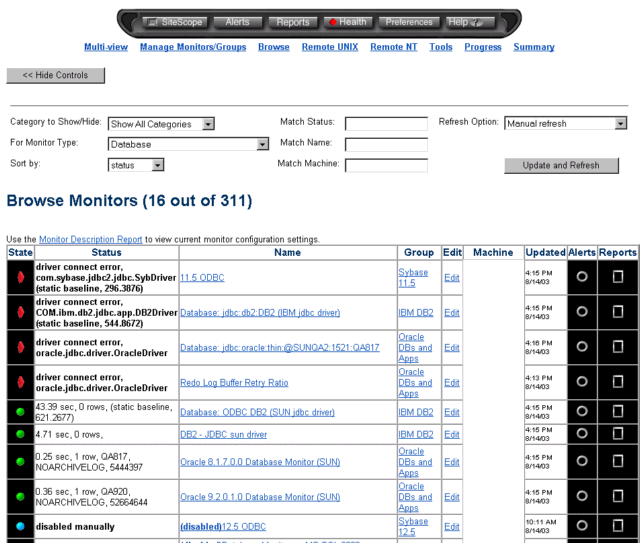
The following shows an example of the Browse Monitors page using the Monitor Type filter selected for Database monitor types in combination with the Category to Show/Hide selected as Show All Categories

- Sort by
-
You use this drop-down list to choose the setting or parameter on which to sort
the monitors. By default, monitors are sorted by status, with the
monitors in error at the top, the monitors in warning below them,
and the monitors that are OK below them.
- Match Status
-
You use this option to filter the monitors by the status of the
monitor. You can use regular expression to
a perform a match in this box.
A regular expression is used to define the values to match. For example, the expression /timed out | unable to reach/ would match monitors which report the status that contains either the string "timed out" or "unable to reach"
- Match Name
-
You use this option to filter the monitors by the name of the monitor.
Enter a name string to match in this box. The match is case
sensitive.
A regular expression is used to define the values to match. For example, the expression /URL Monitor.* \.gov/ would match all monitor names containing the string URL Monitor with addresses containing the domain .gov
- Match Machine
-
Type in the name or IP address of a particular machine to display
only those monitors associated with that machine. You can perform a
match in this item. The match is case sensitive.
A regular expression can be used to define the values to match. For example, the expression /206.168.191.(\d+)/ would match all the machines at ports defined by the last digits of the IP address containing the string 206.168.191.
- Refresh Option
-
You can choose the have this page automatically refresh at
intervals between 15 seconds and 5 minutes. By default, the page is
set to manual refresh and does not refresh automatically.
Click the Update and Refresh button to submit the query or to manually refresh the display with the current filter settings.
How to Filter by Monitor Type
The Monitor Browser is useful to find monitors of a particular type such as CPU Utilization or Database monitors. This is especially useful when you have several dozen or even hundreds of monitors configured.
To filter the monitor list by monitor type:
- Select the category to display using the Category to Show/Hide selection box. To find all monitors of a given type, select the Show All Categories option from the bottom of the list.
- Select the monitor type to display using the For Monitor Type selection box.
- Press the Update and Refresh button to refresh the Browse Monitor Table to the selected filter options.
The Browse Monitor Table
The Browse Monitor table lists each of the monitors that meet the filter criteria selected above. The monitor table provides the following information for each monitor. A link to the Monitor Description Report is also included below the table title. The Monitor Description Report can be used for a quick overview of selected monitor configuration settings such as monitor names and update frequencies.
- Status Icon
- A status icon that indicates whether the monitor's current reading is OK, or whether it indicates a warning, error, or in-progress status. Refer to the individual monitor's help page for an explanation of OK, warning, and error status conditions for that monitor. Clicking on the status icon also provides a shortcut to disable a monitor. Click the icon and a confirmation message will appear asking if you want to disable the monitor. Click the Disable Monitor button to complete the action.
- Status Gauge
- A status gauge that provides a graphical representation of the monitor's current reading. The reading is the current value returned by the monitor, such as 40% full for the Disk Space Monitor. Only those monitors that return a numeric reading have a status gauge.
- Status
- The status returned by the monitor the last time it ran. If the monitor is disabled, the reason for being disabled is displayed.
- Name
- The name that you specified for this monitor. If you didn't specify a name, "untitled [monitor name]" is displayed. The monitor name is also a link that will display the Summary report for that monitor.
- More
- A link to any tools or additional information that may help you to diagnose a problem detected by a particular monitor.
- Edit
- Click the Edit link to edit the specifications for that monitor. For more information about editing a monitor, see the documentation for the specific monitor you want to edit.
- Refresh
- Click the Refresh link to tell SiteScope to run the monitor immediately.
- Updated
- The time that the monitor ran most recently.
- Del
- Click the X in this box to delete the monitor.
 |
 |
 |
