 |
 |
 |
Interpreting Management Reports
SiteScope provides you with a lot of great information about your Web environment, but what does it all mean? Should you be happy with SiteScope's findings, or should you be trying to implement improvements. And what if there is a problem - what then?
How you interpret a SiteScope report is dependent upon the item being monitored. To keep things simple, we will divide the eight SiteScope monitors into two groups: network dependent monitors and network independent monitors. The first group consists of the DNS, URL, Mail, and Ping monitors, all of which depend on network connectivity. The second group consists of the Disk Space, CPU, Service, and Web Server monitors.
An ideal report for all monitors has all green bars with values in an acceptable range. For network dependent monitors the values should be less than a couple of seconds. For network independent monitors, acceptable values will vary. A graph like this means that your site has high availability and is performing well. Good for you!
It is possible that you will see errors (red bars) in your SiteScope reports. The first step is to understand what the errors mean. First, ignore any errors that you were already expecting to see. For example, if your system crashed and you were down for a short time, you would expect to see errors in your reports and you would not need to look any further for a cause. Now you are ready to deal with the other errors you are seeing.
Now you need to determine what type of error you are looking at. There are two basic causes of errors: component failure and capacity overload.
Component Failure
Component failure means something different for network dependent and independent monitors. For network dependent monitors, it is when one of the many pieces necessary to handle requests is down for a period of time. For network independent monitors, it is when the monitored item itself is down. These errors show up as a block of several errors in a row for the duration of the problem. For example, if the Web server process crashes, a report for a URL monitor will show a series of red bars until it is started again.
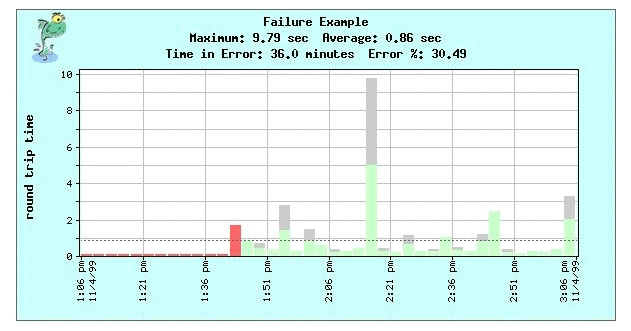
To determine where component failure is occurring for network dependent items, do a traceroute to determine if the errors were caused by your server, your network, your ISP, or the Internet backbone. The necessary corrective action will depend on where you determine the problem is occurring.
For network independent items, first set up an Alert that automatically initiates corrective action to minimize any impact on users. Next, analyze your reports to see if there is a pattern of failure. For example, if you have process that is continually crashing, check to see if there are any consistent factors associated with the crashes, like another process starting up, and so forth.
Capacity Overload
Capacity overload is when an error occurs because some part of your site has reached capacity. For network dependent items these errors appear one at a time on graphs because while most requests are handled correctly, some of them are refused. This type of problem can also show up as increased response times. Often you will notice the increase occurs at the same time every day. For example, if your T1 line is at capacity every morning, you will see higher response times and possibly an error or two on your reports.
For network independent items, these errors can appear as either spikes or continuous high readings on the graph. These high readings may correspond directly to errors reported by other monitors.
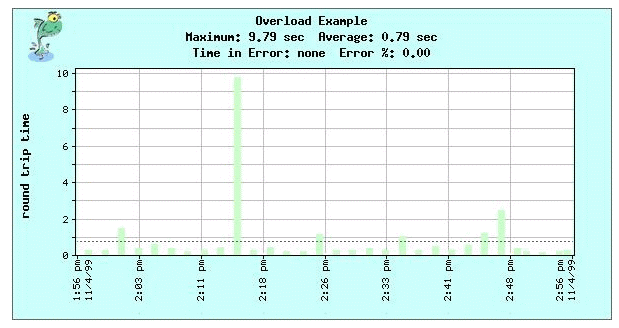
For capacity overload problems, measure the network and server load to see if you are reaching capacity at the same time that SiteScope is reporting your peak response times. Look at reports for CPU, disk use, and memory use. You will also want to look at your Web server report and compare hits with peak usage to determine if specific CGIs are causing a load problem.
Slow Response Time
Even if your reports show no errors, you may still notice that response times are unusually slow at certain times of the day. Use the same techniques used for understanding capacity overload to figure out what's causing your slow response time.
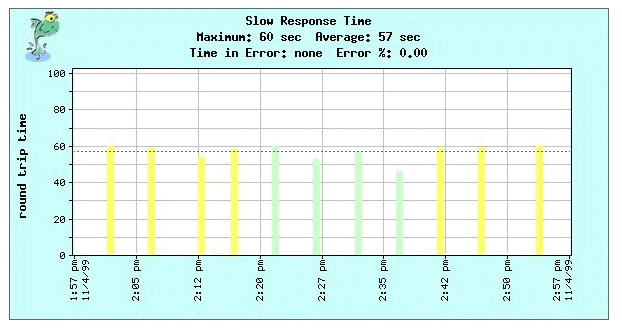
Check to see if you are reaching capacity at the times that SiteScope is reporting slow response times. Look at reports for CPU, disk use, and memory use on the server, and do some log analysis to determine if CGIs are causing the problem

Copyright © 2004 Mercury Interactive Corporation.
All rights reserved.
|
|
|