 |
 |
 |
Management Report Summary
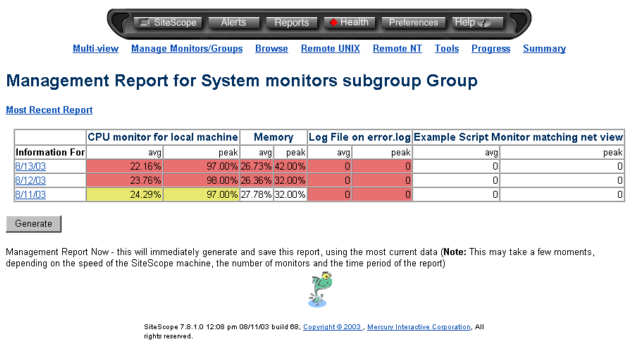
The Management Report Summary page provides an overview of monitor readings for the most recent reporting periods. This page also provides access to the detailed views of the most recently generated management reports for that group. The link above the table takes you to the most recent report while the table itself contains links to the ten most recently generated reports. At the bottom of the page is a Generate button which you can use to generate a new report for the currently displayed monitor(s) regardless of when the report was normally scheduled.
The following is an example of the Management Report Summary page

Clicking the Most Recent Report link above the summary table will display the latest report available for this monitor or group.
The Report column contains date coded links to previously generated reports. The link to the report is actually the date and time the report was generated. For example, in the table above, the first report link contains the following information: 8/13/03. This link would display the report generated for August 18, 2003.
Each report is stored with the content and formatting that was in effect when the report was generated. If you update a report format, the changes will only apply to future reports. Changes are not retroactive to previous reports.
To the right of the Report column you will see columns headed with the names of the monitors being reported on. Each monitor includes two columns of data: avg and peak.
The peak column contains the highest reading returned for each monitor during the reporting period. For example, if three readings of 7, 4, and 13 were returned for a particular monitor during this time period, the peak column would contain the number 13 because it was the highest number returned. To help you quickly spot values that are in the warning or error range defined for that monitor, the background color of the cells with readings in these ranges are colored red or yellow, with red indicating an error status and yellow a warning status.
The avg column contains the average of all the readings returned during the report time period. The average is the sum of all readings returned during the report time period divided by the number of readings taken.
For example, if three readings of 7, 4, and 13 were returned during this time period, the avg column would contain the number 8, which is the average of these three numbers. To help you quickly spot values in the warning or error range, the background color in cells with readings in these ranges are colored red or yellow, with red indicating an error status and yellow a warning status.
 |
 |
 |
