 |
 |
 |
Configuring SiteScope Health Monitoring
The error, warning, and good status thresholds for the SiteScope Health Log Event, Server Load, and SiteScope Configuration Integrity tables are set in the Configure SiteScope Health Indicators page. The following describes the SiteScope Health configuration settings.
- Log Monitors Settings
- SiteScope Server Load Table
- SiteScope Configuration Integrity Table
- Working with health.config File
Log Monitors Settings
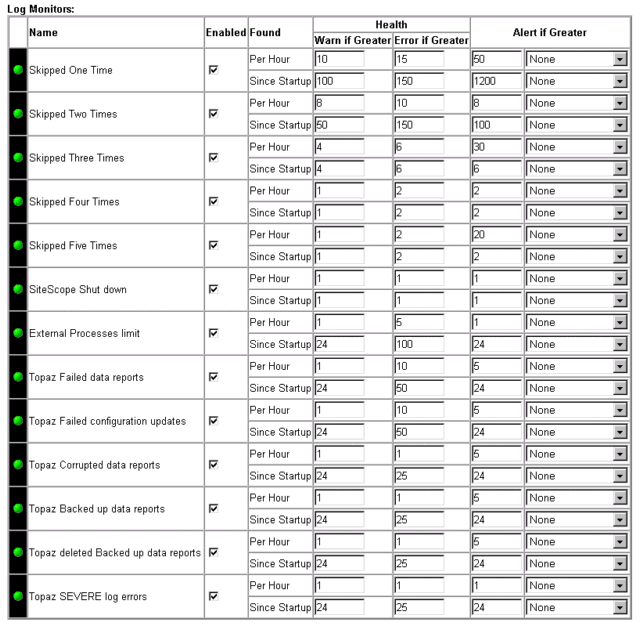
This section describes the configuration settings for the SiteScope Log Monitors table. Use the entries in this table to set the error and warning thresholds for the monitorig of the SiteScope logs. The figure below is an example of the Log Monitors configuration settings.

As shown in the example above, the thresholds for indicating errors decrease as the number of skipped events increases. This is the recommended pattern. While it may be acceptable that the SiteScope monitor load may lead to one or more monitors to skip once occasionally, monitors that skip more than once are indication of a load issue, a monitor configuration problem, or a problem with the monitored system that should be addressed by configuring the applicable monitors timeout and return a warning or error rather than waiting for an unreponsive system to respond.
- Name
-
Indicates the name of the event being monitored. For example,
Skipped One Time is the the name for monitoring the SiteScope error
log for monitors that have skipped once.
- Enabled
-
Use this check box to select if the monitoring of this
item is enabled or disbaled.
- Found
-
This is a heading for two monitoring criteria for measuring log events:
Per Hour and Since Restart counts. The count thresholds are set individually
for these two criteria using the text entry fields under the Health column
described below.
- Health: Warn if Greater
-
This is the warning threshold for the indicated line item. When the
criteria for warning is met, the Health status icon will change to
the warning icon. For example, if more than 5 "skipped four
times" log entries are recorded in one hour, the status icon
for the Skipped Four Times item will change to the warning symbol
 in
the SiteScope Health Page and on the Health button in the
navigation bar.
- Health: Error if Greater
-
This is the error threshold for the indicated line item. When the
criteria for error is met, the Health status icon will change to
the error icon. For example, if more than 5 "skipped four
times" log entries are recorded in one hour, the status icon
for the Skipped Four Times item will change to the error symbol
 in
the SiteScope Health Page and on the Health button in the
navigation bar.
- Alert if Greater
-
The Alert if Greater setting is used to set an e-mail alert
threshold for the corresponding SiteScope Health measurement. Use
the first text entry to set the number of log events that must be
met to trigger an alert. For example, a value of 50 in the Per Hour
line of the Skipped One Time row would trigger an alert if 50 or
more skipped one time entries are recorded in the error log over
the last hour. Use the selection box on the right to select the e-mail profile
to use when sending the e-mail. Use the Additional E-mail Settings
from the E-mail Preferences page to
create new e-mail profiles.
Note: The default setting is None, which means that no alert will be sent. Any warning or error conditions will only be indicated visually in the icons displayed on the Health page and the Health button in the main navigation bar at the top of SiteScope pages.
After making changes to the Log Monitors configuration settings, click the Save Changes button to record the changes and update the health settings.
SiteScope Server Load Table
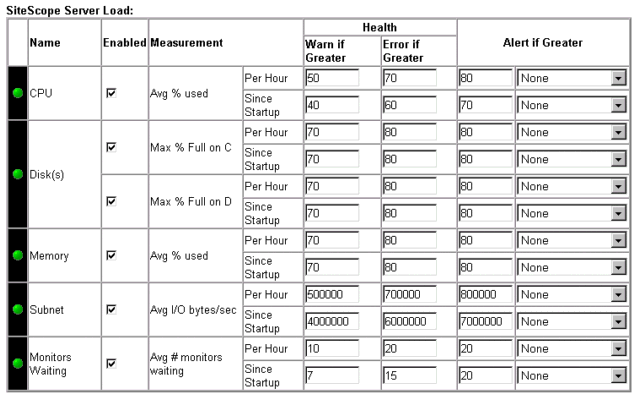
This section describes the configuration settings for the SiteScope Server Load monitors table. The figure below is an example of the Server Load configuration settings.

- Name
-
This is the name of the monitored server performance parameter.
- Enabled
-
Use this check box to select if the monitoring of this
item is enabled or disbaled.
- Measurement
-
This is a heading column for the type of monitor and measurement
being made as well as the Per Hour and Since Restart entries
displayed in the SiteScope Server Load Table.
- Health: Warn if Greater
-
This is the warning threshold for the indicated line item. When the
criteria for warning is met, the Health status icon will change to
the warning icon. For example, if the average CPU utilization on
the SiteScope server exceeds during one hour, the status icon for
the CPU item will change to the warning symbol
 in the
SiteScope Health Page and on the Health button in the navigation
bar.
- Health: Error if Greater
-
This is the error threshold for the indicated line item. When the
criteria for error is met, the Health status icon will change to
the error icon. For example, if the average disk space usage
exceeds 70 percent during one hour, the status icon for the Disk(s)
item will change to the error symbol
 in the
SiteScope Health Page and on the Health button in the navigation
bar.
- Alert if Greater
-
The Alert if Greater setting is used to set an e-mail alert
threshold for the corresponding SiteScope Health measurement. Use
the first text entry to set the monitor status value that must be
met to trigger an alert. For example, a value of 80 in the Per Hour
line of the CPU monitor row would trigger an alert if the average
of SiteScope CPU utilization exceeded 80 percent during the last
hour. Use the selection box on the right to select the e-mail profile
to use when sending the e-mail. Use the Additional E-mail Settings
from the E-mail Preferences page to
create new e-mail profiles.
Note: The default setting is None, which means that no alert will be sent. Any warning or error conditions will only be indicated visually in the icons displayed on the Health page and the Health button in the main navigation bar at the top of SiteScope pages.
After making changes to the Server Load configuration settings, click the Save Changes button to record the changes and update the health settings.
SiteScope Configuration Integrity Table
This section describes the configuration settings for the SiteScope Configuration Integrity monitors table. The figure below is an example of the Configuration Integrity configuration settings.

- Name
-
The name of the monitored element
- Enabled
-
Use this check box to select if the monitoring of this
item is enabled or disbaled.
- Measurement
-
This is a heading column for the type of monitor and measurement
being made as well as the Per Hour and Since Restart entries
displayed in the SiteScope Server Load Table.
- Health: Warn if Greater
-
This is the warning threshold for the indicated line item. When the
criteria for warning is met, the Health status icon will change to
the warning icon. For example, if the average CPU utilization on
the SiteScope server exceeds during one hour, the status icon for
the CPU item will change to the warning symbol
 in the
SiteScope Health Page and on the Health button in the navigation
bar.
- Health: Error if Greater
-
This is the error threshold for the indicated line item. When the
criteria for error is met, the Health status icon will change to
the error icon. For example, if the average disk space usage
exceeds 70 percent during one hour, the status icon for the Disk(s)
item will change to the error symbol
 in the
SiteScope Health Page and on the Health button in the navigation
bar.
- Alert if Greater
-
The Alert if Greater setting is used to set an e-mail alert
threshold for the corresponding SiteScope Health measurement. Use
the first text entry to set the monitor status value that must be
met to trigger an alert. For example, a value of 80 in the Per Hour
line of the CPU monitor row would trigger an alert if the average
of SiteScope CPU utilization exceeded 80 percent during the last
hour. Use the selection box on the right to select the e-mail profile
to use when sending the e-mail. Use the Additional E-mail Settings
from the E-mail Preferences page to
create new e-mail profiles.
Note: The default setting is None, which means that no alert will be sent. Any warning or error conditions will only be indicated visually in the icons displayed on the Health page and the Health button in the main navigation bar at the top of SiteScope pages.
After making changes to the SiteScope Configuration Integrity configuration settings, click the Save Changes button to record the changes and update the health settings.
Working with health.config File
The entries in the health.config file are configurable via the Configure SiteScope Health Indicators page. You should use this interface to make changes to this file. In the case that you need to change the description that appears in the Name columns of the Health tables or the data labels (for example: Avg % used or Max % Full on) in the SiteScope Server Load table, you can edit the health.config file. To change the Name descriptions, edit the _name=namedescription entry. To change the data labels, edit the _valueLabel=descriptor entry.
Note: Do not add any extra spaces or lines to the file.
The following is a partial listing of the default health.config file showing the syntax of the entries in the file.
	_health=good
	_name=health config
	_version=1.0
	#
	_class=logEvent
	_hourWarn=30
	_sessionWarn=720
	_search=skipped #1
	_sessionAlert=1200
	_type=log
	_hourAlert=50
	_sessionError=1200
	_emailSessionWho=_id:n
	_hourError=50
	_emailHourWho=_id:n
	_name=Skipped One Time
	#
	...
	#
	_class=CPU
	_hourWarn=50
	_sessionWarn=40
	_generalLabel=Avg % used
	_sessionAlert=70
	_type=schedule
	_session=31
	_valueLabel=Avg % used
	_hourAlert=80
	_sessionError=60
	_emailSessionWho=_id:n
	_hourError=70
	_emailHourWho=_id:n
	_numValues=59
	_name=CPU
	_hour=38
	...
	#
	_class=MonitorsWaiting
	_hourWarn=10
	_sessionWarn=7
	_generalLabel=Avg # monitors waiting
	_sessionAlert=20
	_type=schedule
	_session=0
	_valueLabel=Avg # monitors waiting
	_hourAlert=20
	_sessionError=15
	_emailSessionWho=_id:n
	_hourError=20
	_emailHourWho=_id:n
	_numValues=58
	_name=monitorsWaiting
	_hour=0
 |
 |
 |
