 |
 |
 |
Monitoring SiteScope Server Health
For reliability of operations monitoring depends in part on the reliability of the monitoring application. SiteScope can monitor several key aspects of its own environment to help uncover monitor configuration problems as well as SiteScope server load. Optionally, SiteScope can also monitor connectivity and data events when connected to Mercury Interactive's Topaz.
This section describes:
- The SiteScope Health Page
- SiteScope Log Event Table
- About Skipped Monitors
- SiteScope Server Load Table
- SiteScope Configuration Integrity Tables
- Understanding Topaz Log Events
The SiteScope Health Page
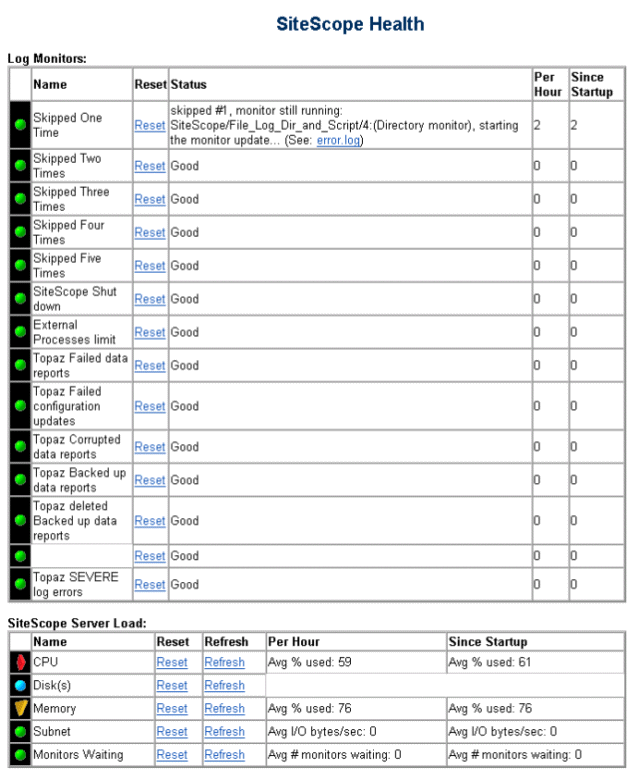
The Health button is part of the common navigation bar at the top of each SiteScope screen. Included in the button graphic is a status icon that indicates if the SiteScope Health monitoring has detected a problem that could be impacting monitoring performance. Click the Health button to go to the SiteScope Health page.Below is an example of the upper section of the SiteScope Health page showing the Log Event and Server Load tables.
The SiteScope Health page includes several tables that display information from the SiteScope's monitoring of its own health. These tables include:
Each table displays a set of information, including a status icon, indicating the state of a number of SiteScope performance and configuration parameters. The information in these tables is discussed below.
The SiteScope Health Page also includes other links for working with the SiteScope Health monitoring feature. These links are displayed below the tables in the section labeled "Edit Health Monitors". This section includes links to configure the Health monitoring error thresholds and a link to disable/enable SiteScope Health monitoring. The following describes the health configuration links:
- Configure
-
Click this link to display the Configure
SiteScope Health Indicators page.
This configuration page is used to enable, disable, set threshold ranges,
and set alert conditions for the SiteScope Health monitors.
- Restore
-
Use this link to reload the default settings for all the Health monitors.
This will reset the error and warning thresholds for all the monitors to
the default values that are shipped with SiteScope.
- Reset
-
Use this link to reset the status values for all the Health monitors.
This is a global action equivalent to
pushing all the individual Reset links at the same time.
The reset will generally clear any error or warning status and the applicable
monitors will restart their status reporting from an initial conditon of "good".
- Disable/Enable
-
Use this link to disable all SiteScope Health monitors.
This will stop any health monitors from running based on a schedule or
by using the manual Refresh link. When disabled, this link is changed
to Enable. Click the Enable to enable or re-enable all
health monitors that were disabled.
SiteScope Log Event
SiteScope Log Event shows incidents of skipped monitors and events related to connectivity and logging of SiteScope data to Mercury Interactive's Topaz. Data is reported in the Log Event table as follows:
- Name
-
This is the name for the log event being monitored. The following
are monitored events for SiteScope:
- Skipped One Time
- Skipped Two Times
- Skipped Three Times
- Skipped Four Times
- Skipped Five Times
- SiteScope Shut down
- External Processes limit
The Skipped <number> Time(s) events indicate if there are monitors that are reported as skipping the number of times indicated by <number>. For example, the line named Skipped One Time will indicate data for monitors that have skipped once during the period indicated. The most common causes of monitors skips are:
- monitors set to run too frequently
- monitors watching systems that are too slow to respond
The SiteScope Shut down indicates if SiteScope has encountered a conditions that made SiteScope automatically shutdown and restart itself. One event that can cause this is any monitor that skips more than five times.
The External Processes limit indicates if the predefined maximum number of external processes has been reached. Monitors that rely on external processes for execution are waiting more than 30 seconds before getting a process. Description: SiteScope is using all the external processes for executing other monitors. This can cause monitors to "skip" their scheduled. This indicates that the predefined max of external processes reached its limit. If the SiteScope server machine settings are not set to allow the number of processes being used by SiteScope, increase process limit. If the machine is set at its process limit already, decrease the load on SiteScope server by reducing the number of monitors running per minute. You can do this by increasing the Update Every frequency interval for less critical monitors.
For monitoring the health of Topaz connectivity, the following events are logged:
- Topaz Failed data
- Topaz Failed configuration updates
- Topaz Corrupted data reports
- Topaz Backed up data reports
- Topaz deleted Backed up data reports
- Topaz SEVERE log errors
See the Understanding Topaz Log Events section below for more details on Topaz Log Events.
- Reset
- Click the hyperlink in this column to reset the current status
and clear the current history for this health monitor. You use this to
clear the history for an item that you have addressed and reset the monitoring
from a condition of "Good".
- Status
-
The status column reports the status of the monitor as good
if no log events are reported. If there was a log event, data about
the most recent log event is displayed in the Status column. The
text in the Status column is also a link to the SiteScope error log
which contains detailed log events with information about what
monitors may be skipping.
- Per Hour
-
The Per Hour column shows a cumulative total of the log events
meeting the criteria of the log event. In the case of Skipped
One Time, the Per Hour column shows the total number of
times that any monitor skipped one time in the last
hour. In the case of Skipped Two Times, the Per Hour column
shows the total number of times that any monitor
skipped two times in the last hour. Any monitor that skipped two
times will also have skipped one time with the first skip being
added to the Skipped One Time total.
- Since Restart
-
As with the Per Hour column, the Since Restart column shows a
cumulative total of the log events meeting the criteria log event.
In the case of Skipped One Time, the Since Restart column
shows the total number of times that any monitor
skipped one time since the last time SiteScope restarted. SiteScope
is programmed to restart itself once per day or whenever any
monitor skips six times or more.
About Skipped Monitors
A SiteScope monitor will be reported as "skipped" if the monitor fails to complete its actions before it is scheduled to run again. This can occur with monitors that have complex actions to perform, such as querying databases, stepping through multi-page URL sequences, waiting for scripts to run, or waiting for an application that has hung.
For example, assume you have a URL Sequence Monitor that is configured to transit a series of eight Web pages. This sequence includes performing a search which may have a slow response time. The monitor is set to run once every 60 seconds. When the system is responding well, the monitor can run to completion in 45 seconds. However, at times, the search request takes longer and then it takes up to 90 seconds to complete the transaction. In this case, the monitor will not have completed before SiteScope is scheduled to run the monitor again. SiteScope will detect this and make a log event in the SiteScope error log. The SiteScope Health monitors will detect this and make an entry in the SiteScope Log Event table.
Skipped monitors cause a number of problems. One is the loss of data when a monitor run is suspended due because a previous run has not completed or has become hung by a unresponsive application. Skipped monitors can also cause SiteScope to automatically stop and restart itself. This is done in an effort to clear problems and reset monitors. However, this can also lead to gaps in monitoring coverage and data. Adjusting the run frequency (Update every) at which a monitor is set to run or specifying an applicable timeout value can often correct the problem of skipping monitors. Investigation of unresponsive systems that are being monitored may also be necessary.
Note: A Max Monitor Skipping setting has been added to allow monitors that are skipping to be disabled automatically. If this occurs, SiteScope is not restarted but an e-mail is sent to the SiteScope administrator about the skipping monitor to signal the disable event. This optional functionality is disabled by default but can be enabled by changing the _shutdownOnSkips to remove the value in the master.config file or remove the setting entirely.
Since it is often not obvious that a monitor is skipping, the SiteScope Health feature is designed to monitor the SiteScope logs and report on skipped monitor events.
The SiteScope Health monitors update the SiteScope Log Event Table whenever a new entry is added to the SiteScope error log or the Topaz error log.
SiteScope Server Load
SiteScope Server Load table is the equivalent of a SiteScope monitor group that monitors server resources on the server where SiteScope is running. This includes monitors for CPU, disk space, memory, and so forth, along with a check of how many monitors are waiting to be run (see the Progress Report page). A problem with resource usage on the SiteScope server may be caused by monitors with configuration problems or may simply indicate that a particular SiteScope is reaching it performance capacity. For example, high CPU usage by SiteScope may indicate that the total number of monitors being run is reaching a limit. High disk space usage may indicate that the SiteScope monitor data logs are about to exceed the capacity of the local disk drives (see Log Preferences for SiteScope data log options).
The SiteScope Server Load monitors report their data to the SiteScope Server Load table as follows:
- Name
-
This is the name of the resource or parameter that is being
monitored. This is usually the same as the type of monitor being
used. These names are customizable in the
SiteScope/groups/health.config file (see example
below).
- Reset
- Click the hyperlink in this column to reset the current status
and clear the current history for this health monitor. You use this to
clear the history for an item that you have addressed and reset the monitoring
from a condition of "Good".
- Refresh
-
This column presents a link you use to manually refresh the monitor
readings for each item. By default, the Server Load monitors run
automatically at ten minute intervals.
- Per Hour
-
The Per Hour column shows the average of the measured parameter for
the last hour.
- Since Restart
-
The Since Restart column shows the average of the measured
parameter for the last hour.
SiteScope Configuration Integrity
The SiteScope Configuration Integrity section includes special monitors that check on the integrity of several key files that are essential to the correct operation of the SiteScope application. The following is an example of the SiteScope Configuration Integrity tables.
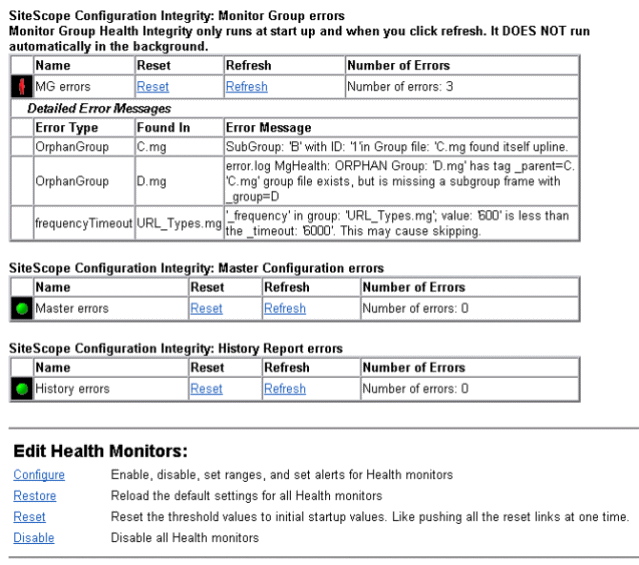
An overview of the SiteScope integrity monitoring is described in the following table:
|
Monitored Item |
Description |
|---|---|
|
MG (Monitor Group) Integrity |
Monitors integrity of files that define SiteScope groups, subgroups, and individual monitors. |
|
Master Integrity |
Monitors integrity of the key SiteScope configuration files and parameters that are essential for the operation of the SiteScope application. |
|
History (Reports) Integrity |
Monitors integrity of files and parameters that define SiteScope Management Reports. |
In most installations and deployments, the integrity of the configuration files will be managed correctly and no errors will be detected. However, due to the high degree of flexibility in configuring and managing SiteScope, there are a number of cases where configuration files may be changed, copied, or created manually rather than by the SiteScope program itself. In these cases, the Configuration Integrity checks will help detect when errors have been introduced
The SiteScope Configuration Integrity monitors report their data to the SiteScope Configuration Integrity table as follows:
- Name
-
This is the name of the resource or parameter that is being
monitored. This is usually the same as the type of monitor being
used. These names are customizable in the
SiteScope/groups/health.config file (see example
below).
- Reset
- Click the hyperlink in this column to reset the current status
and clear the current history for this health monitor. You use this to
clear the history for an item that you have addressed and reset the monitoring
from a condition of "Good".
- Refresh
-
This column presents a link you use to manually refresh the monitor
readings for each item. By default, the Server Load monitors run
automatically at ten minute intervals.
- Number of Errors
-
The Number of Errors column shows the number of errors detected in the
subject files.
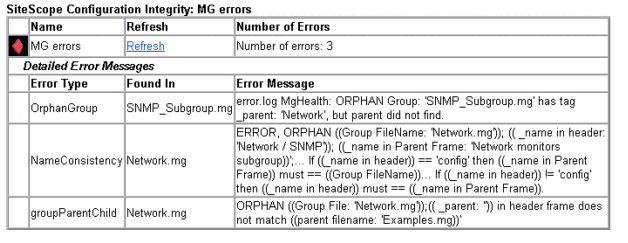
If an error is detected in the configuration files a Detailed Error Messages section is appended below the applicable table with itemized description of the error. The following is an example of error messages for errors found in several monitor group (MG) files.
The number of errors, their description, and resolution are currently beyond the scope of this document. Experienced SiteScope users can use the description as a guide to resolve errors. If you have questions, please contact Mercury Interactive Customer Support.
Understanding Topaz Log Events
The following table presents an explanation of several possible Topaz Log Events that may be detected by the SiteScope Log Event monitoring.
|
Event Title |
Severity |
Symptom |
Description |
Action |
|---|---|---|---|---|
|
SEVERE log errors |
Error |
New SEVERE messages in topaz_all.log |
Print the errors |
|
|
Failed configuration updates |
Warning |
Existence of files in the cache/persistent/ topaz/config, cache/persistent/ topaz/bus. These files are in the format of <system time in milliseconds>.topaz. |
Some monitor results were not sent to the Topaz Agent Server. SiteScope will attempt to resend these reports on a schedule. These reports date back to <date>, where <date> is the translation of the file name section that indicates the system time. |
This may indicate that Topaz Admin Server is down or is not responding correctly. Verify that the server is up. |
|
Failed data reports |
Warning |
Existence of files in the cache/persistent/ topaz/ data, cache/persistent/ topaz/bus. These files are in the format of <system time in milliseconds>.topaz. |
Some configuration events were not sent to the Topaz Admin Server. SiteScope will attempt to resend these reports on a schedule. These reports date back to <date>, where <date> is the translation of the file name section that indicates the system time. |
This may indicate that Topaz Agent Server is down or is not responding correctly. Verify that the server is up. |
|
Corrupted data reports |
Error |
Existence of files in the cache/persistent/ topaz/data_error, cache/persistent/ topaz/bus_error. These files are in the format of <system time in milliseconds>.topaz. |
Topaz Agent Server failed to process data reports. These reports date back to <date>, where <date> is the translation of the file name section that indicates the system time.
|
Contact support |
|
Topaz deleted Backed up data reports |
Error |
Directories of the type of cache/ persistent/ topaz/data.old or cache/ persistent/ topaz/bus.old are being deleted. These files are in the format of <system time in milliseconds>.topaz. |
The number of .old dir exceeded the predefined limit. The oldest directory of this type will be deleted.
|
This indicates that a big amount of data was not reported to Topaz (probably because topaz AgentServer was down for a long time), so to prevent going out of disk space we will delete the oldest data. This data will be lost. To prevent this from happening, gradually move the files from the <name>.old folder to the <name> folder, and once you're done delete this folder. You can also increase this limit (default is configured to max of 10 .old dirs, which is approximately 1.5 GB). |
|
Backed up data reports |
Error |
Existence of files in the cache/persistent/ topaz/data.old, cache/persistent/ topaz/bus.old. These files are in the format of <system time in milliseconds>.topaz. |
The number of cached data files exceeded the predefined limit. These files were moved to the <directory> folder, where <directory> is the path of the folder where these files are located |
This indicates that SiteScope was overloaded with Topaz reporting tasks. Gradually move the files from the <name>.old folder to the <name> folder. SiteScope will attempt to resend these files on a schedule. |

Copyright © 2004 Mercury Interactive Corporation.
All rights reserved.
|
|
|